Why Your Mac Gets Slower the Longer You Code on It (It's Not RAM, It's Disk)
The instinct when a Mac feels slower than it used to is to blame RAM — too many Chrome tabs, too many Electron apps, time to upgrade or close things. For developers specifically, that's usually the wrong diagnosis. The much more common cause is free disk space, and it's a cause almost nobody checks first because it doesn't show up anywhere obvious.
This isn't about needing a bigger drive. It's about how close to full your current one has gotten, and what that does to a system that's constantly writing and deleting large files — which, if you build software for a living, describes your Mac every single day. Every npm install, every Docker build, every Xcode compile writes gigabytes of temporary and intermediate data to disk, then deletes most of it again a few minutes later.
That pattern — write a lot, delete a lot, repeat all day — is exactly the workload that suffers most as free space shrinks, which is why developers tend to notice this particular slowdown more acutely than someone whose Mac mostly just browses the web and plays music.
How free space affects SSD performance
SSDs need free blocks available to write to efficiently. As a volume fills up, the drive's controller has more trouble finding contiguous free space and has to do more background work — moving data around, garbage-collecting freed blocks — to keep writing new data at full speed. This is sometimes called write amplification, and it gets meaningfully worse once a drive drops below roughly 10-15% free space.
On macOS specifically, APFS complicates the picture further with something called purgeable space — space that's technically reclaimable (like old local Time Machine snapshots) but doesn't count as free until the system actually decides to reclaim it, often under memory or disk pressure. That means the free space number you see in Finder isn't always the free space actually available to the SSD controller in the moment you need it.
There's a second, more direct effect for developers specifically: a large compile or a docker build that needs to write, say, 15GB of intermediate output temporarily can genuinely fail or stall if your free space is already down near single-digit gigabytes, since the OS and the toolchain both need working room beyond just the final output size. This shows up as builds that inexplicably get slower or occasionally hang near the end, well before you'd hit an explicit "disk full" error.
Local Time Machine snapshots quietly eating your headroom
If Time Machine is enabled, macOS keeps local snapshots on your internal drive even when your backup destination isn't connected, as a safety net. Check what's currently held with tmutil listlocalsnapshots /. macOS is supposed to thin these automatically as space gets tight, but on a developer machine that's rapidly creating and deleting large files — Docker layers, build artifacts, node_modules churn — that automatic thinning can lag behind, leaving snapshots holding onto disk blocks longer than you'd expect. tmutil thinlocalsnapshots can force the issue if you want to reclaim that space immediately rather than waiting for macOS to decide it's necessary.
The reason this specifically bites developers harder than other users: a snapshot taken an hour ago pins the disk blocks that made up that Docker image or that node_modules folder at the time, even after you delete the folder itself. Until the snapshot ages out or gets thinned, the space you thought you freed isn't actually available yet — which is a common source of confusion when du -sh shows a folder is gone but df -h doesn't show the space back.
Spotlight indexing your own build output
A less obvious cause of ongoing sluggishness: Spotlight tries to index every file it can see, including the thousands of files inside node_modules, target/, and DerivedData that get created and destroyed constantly during active development. On a large monorepo, this can keep mdworker processes busy in the background, competing with your actual build for disk I/O.
Check indexing status with mdutil -s / (add -X for external volumes). If you notice mds or mdworker using a lot of CPU or disk activity in Activity Monitor right after a big build or install, excluding heavy build directories from Spotlight is worth doing — either add them under System Settings → Siri & Spotlight → Spotlight Privacy, or drop a file named .metadata_never_index inside a folder you want Spotlight to skip entirely.
This matters more on a low-space drive than a roomy one, because the same background indexing work that's mildly annoying on a half-empty disk becomes actively competitive for I/O bandwidth once the drive's own write performance has already degraded from being full — the two problems aren't independent, they stack.
Where swap fits in — and where it doesn't
To be fair to the RAM instinct: memory pressure is a real and separate cause of slowdown, and it's worth ruling out. sysctl vm.swapusage shows how much swap macOS is currently using, and Activity Monitor's Memory tab shows "Swap Used" directly — if that number is consistently high, more RAM or fewer running apps genuinely would help.
But swap and disk space interact: swap files themselves need free disk space to grow into, and a nearly-full drive gives macOS less headroom to manage swap efficiently on top of everything else it's already doing. On a Mac that's both low on free space and under memory pressure from a heavy build, the two problems compound each other rather than being independent.
This is why the RAM instinct isn't entirely wrong, just incomplete: adding RAM reduces how often the system needs to swap at all, which helps, but it doesn't address the underlying disk write performance problem if free space is still tight. A developer who upgrades RAM without ever checking free space sometimes finds the slowdown only partially improves, and mistakenly concludes the upgrade didn't work rather than realizing there was a second, untouched cause the whole time.
The symptoms that actually point to disk, not RAM
A few specific patterns are worth recognizing, because they're easy to misattribute to memory pressure when the real cause is free space. Finder windows that take a noticeable moment to open or refresh. npm install or a Docker build that used to take two minutes now taking five, with no change to the project itself. Spotlight search (Command-Space) feeling laggy compared to how it used to respond. The beachball showing up specifically during file save or file copy operations rather than during CPU-heavy work like compiling.
Each of these is a disk I/O symptom, not a memory one — memory pressure tends to show up as overall system sluggishness and app launches slowing down uniformly, while disk pressure shows up specifically around anything that reads or writes files, which for a developer is most of the day.
A simple diagnostic routine
Before assuming you need more RAM, or a new machine entirely, run through this in order: check actual free space with df -h /, check what's purgeable in System Settings → General → Storage, check for large recent categories using a disk scanner rather than Finder, and glance at Activity Monitor for mdworker or backupd activity spiking during builds. This takes a few minutes and usually points straight at the actual cause instead of guessing.
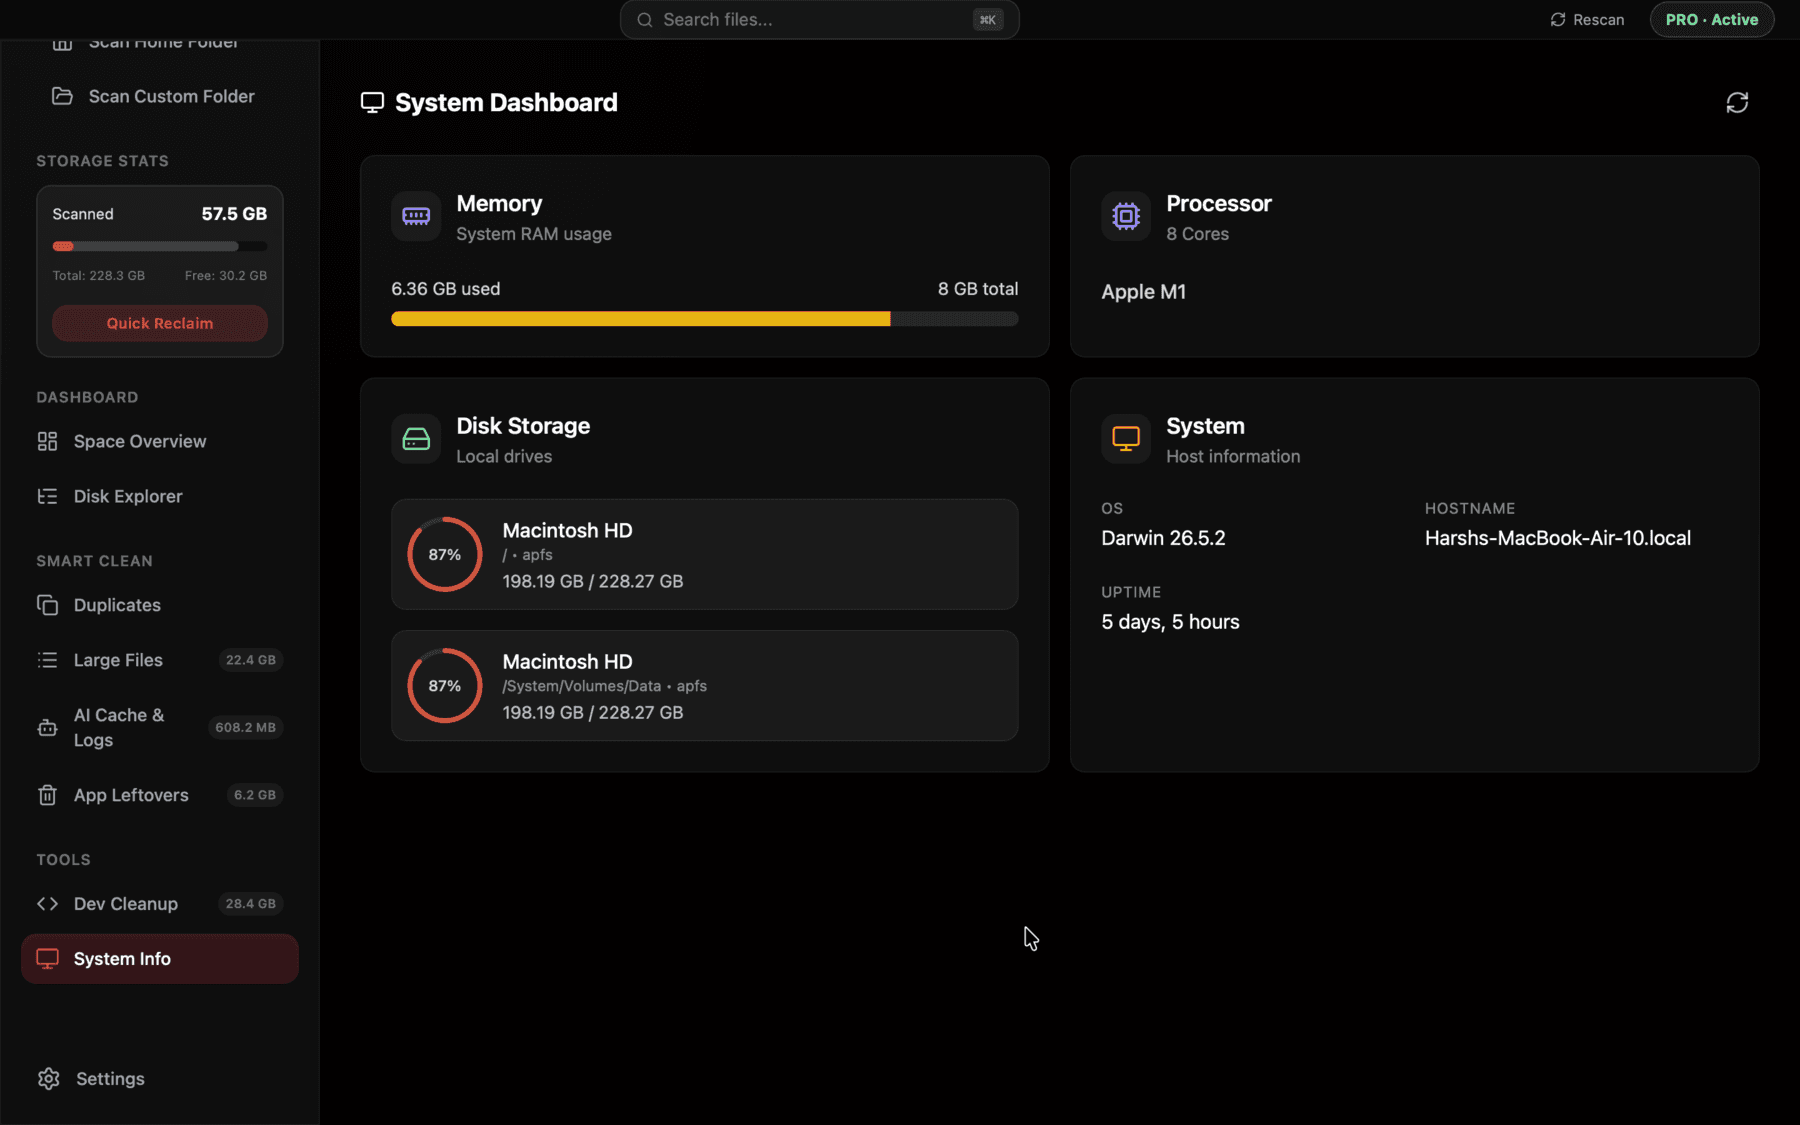
Shows real free space alongside what's actually using it on one screen, instead of piecing the picture together from df, About This Mac, and Activity Monitor separately.
What actually restores speed
For most developers, the fastest fix is clearing the regenerable dev caches that got you into a low-free-space state in the first place — node_modules folders you're not actively using, old Xcode DerivedData, unused Docker images and volumes, stale Rust target/ directories. These tend to be the largest reclaimable chunks on a dev machine and, unlike personal files, cost you nothing but a slightly slower next build to get back. A tool that groups these by category, the way Reclaim's Dev Cleanup view does, makes it a five-minute task instead of an afternoon of manual du -sh commands across a dozen folders.
Once free space is back into a comfortable range — comfortably above that 10-15% threshold — a lot of the day-to-day sluggishness (slower app launches, longer Spotlight searches, laggier Finder) tends to resolve on its own, without touching RAM at all.
It's worth running this check periodically rather than only when things feel slow, since the slowdown tends to arrive gradually enough that you adjust to it without noticing — the version of "normal" your Mac feels like today might already be the degraded one, and you won't have a clear before-and-after unless you check free space now and compare it to what you find in a few months.
None of this requires becoming a systems administrator about your own laptop. A five-minute check every couple of months — df -h /, a glance at what's purgeable, a scan of the usual dev cache suspects — is enough to keep free space in a range where the SSD, Spotlight, and swap are all working with you instead of against you.
Frequently asked questions
Does low disk space actually slow down a Mac?
Yes. SSDs need free blocks to write efficiently, and performance degrades as a drive fills up, particularly once free space drops below roughly 10-15% of total capacity.
Why does my Mac feel slower after months of development work, even with the same amount of RAM?
Accumulated dev caches — node_modules, Xcode DerivedData, Docker images, Rust target folders — gradually eat into free disk space, and reduced free space slows SSD write performance independent of how much RAM is installed or in use.
What is purgeable space on macOS and why doesn't it count as free?
Purgeable space is data macOS can reclaim automatically when needed, like local Time Machine snapshots, but it isn't freed until the system actually decides to reclaim it — so it can inflate the gap between what Finder reports as used and what's genuinely available right now.
How do I check how much swap my Mac is using?
Run sysctl vm.swapusage in Terminal, or open Activity Monitor's Memory tab and look at the Swap Used figure at the bottom of the window.
Can Spotlight indexing slow down a developer machine?
Yes, particularly on large monorepos — Spotlight tries to index every file inside node_modules, target/, and similar build directories as they're created and deleted, which can keep mdworker processes competing for disk I/O during builds.
What's the fastest way to free up disk space on a dev Mac?
Clear regenerable caches first — node_modules, Xcode DerivedData, unused Docker images and volumes, Rust target/ folders — since they're usually the largest reclaimable chunks and rebuild automatically the next time you need them.
See exactly what’s using your disk space.